
Challenge
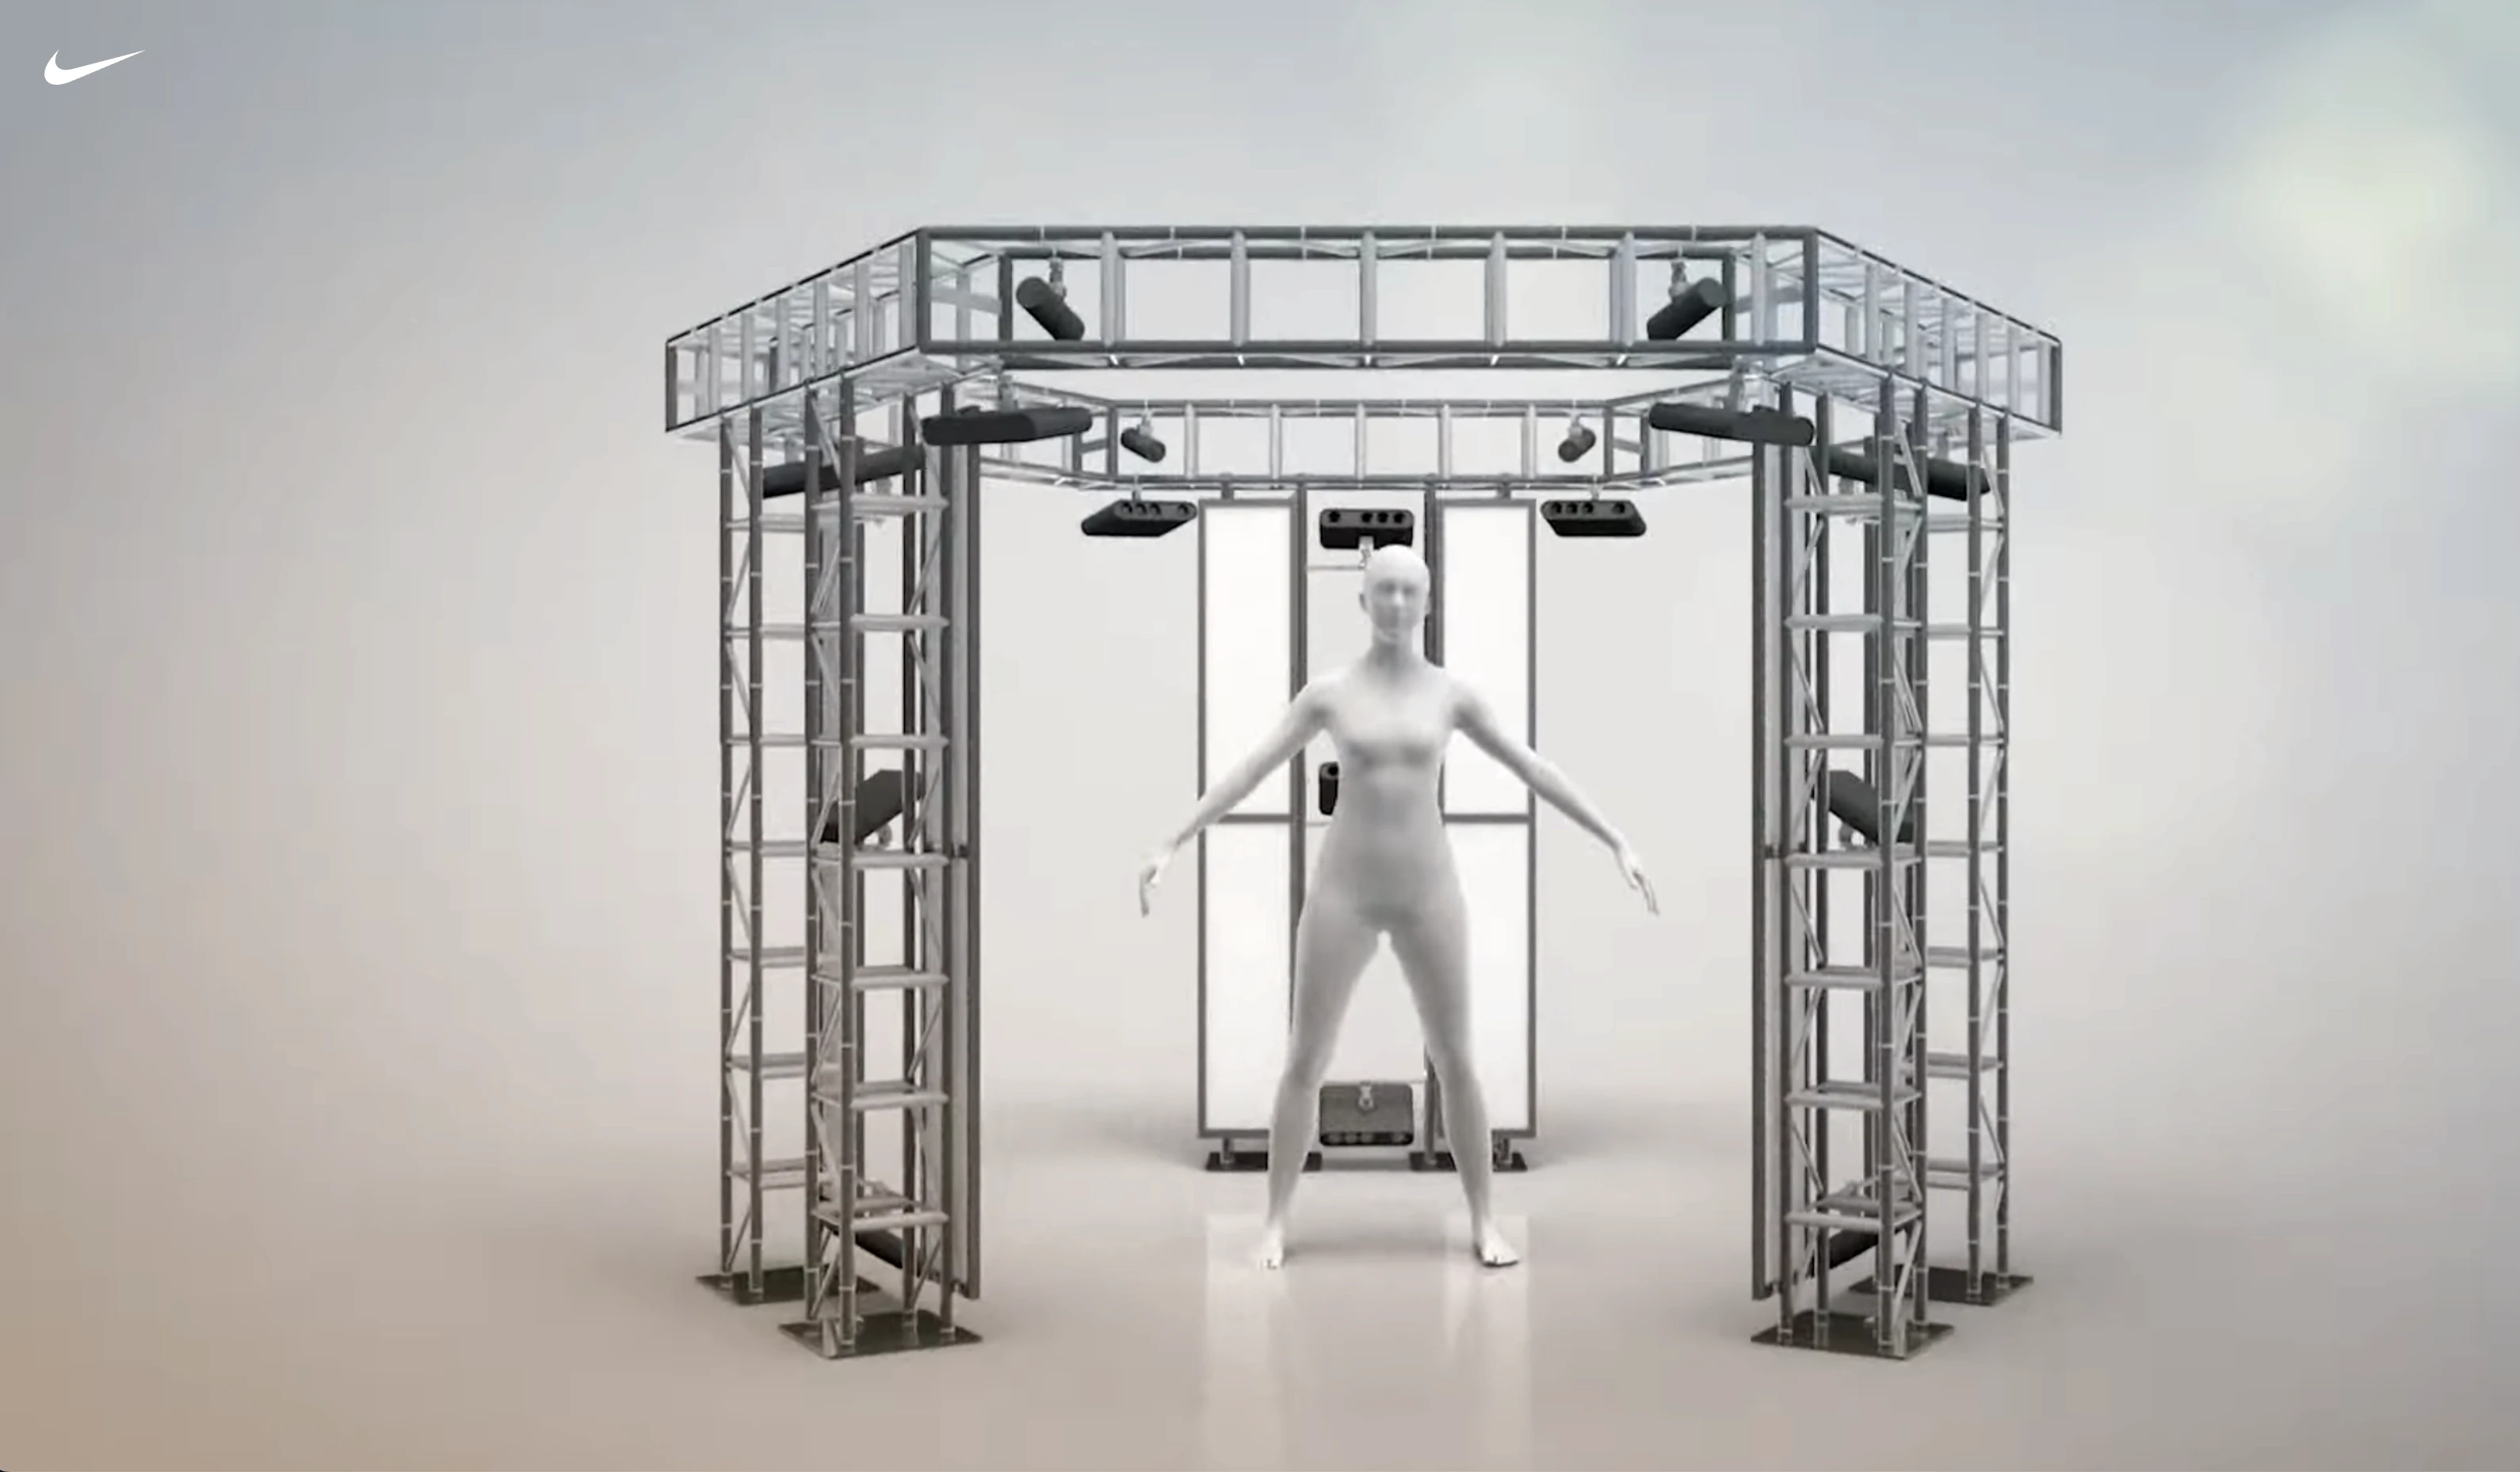
Nike’s innovation labs collect extensive body metric data from athletes across a wide range of sports—from how and where sweat is produced during a run to the exact impact zones of a soccer ball on the foot, or how a pivot foot strikes the ground during a basketball move. While this data is invaluable for creating next-generation products, it was often difficult for Nike’s in-house designers to access, interpret, and apply in their design process.
ATLAS was created to bridge that gap: a centralized web platform that transformed complex performance data into clear, actionable insights for Nike’s footwear and apparel design teams. As the sole UX designer on the project, I was responsible for shaping the user experience to make that information not only accessible but highly usable within the context of a fast-moving, creative workflow.
Research & Discovery
To ensure the platform met the needs of its core users, I conducted a series of interviews and feedback sessions with Nike’s internal footwear and apparel designers. We explored how they currently accessed data, where pain points existed, and what types of insights had the most impact on their work.
A few key insights emerged:
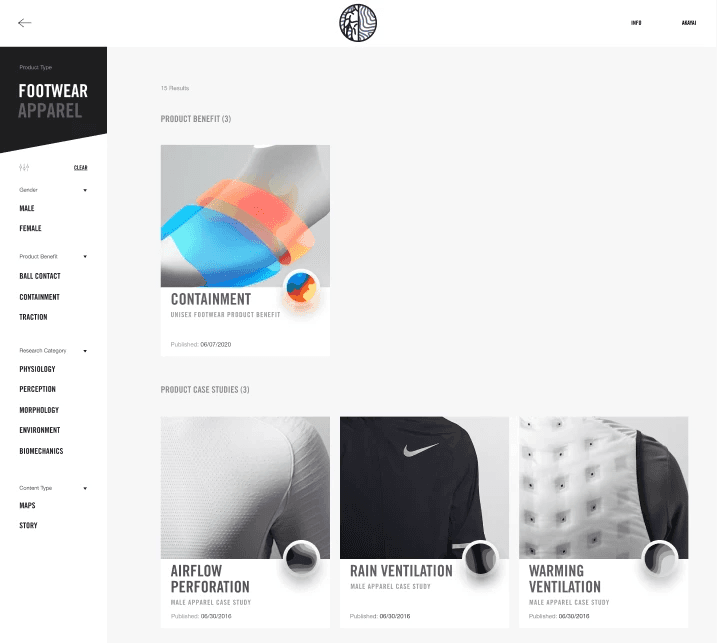
Designers wanted quick, visual access to complex data without digging through spreadsheets or static reports.
There was a strong need for contextual storytelling—not just raw data, but meaningful takeaways that could inspire material innovation or design changes.
A major gap existed in the ability to compare metrics across different variables like gender, movement type, or impact zones—this inspired the development of a “Comparison Mode” feature.
Design Approach
With these insights in mind, I focused the UX strategy around three core principles: visual clarity, contextual insight, and interaction simplicity.
Key solutions included:
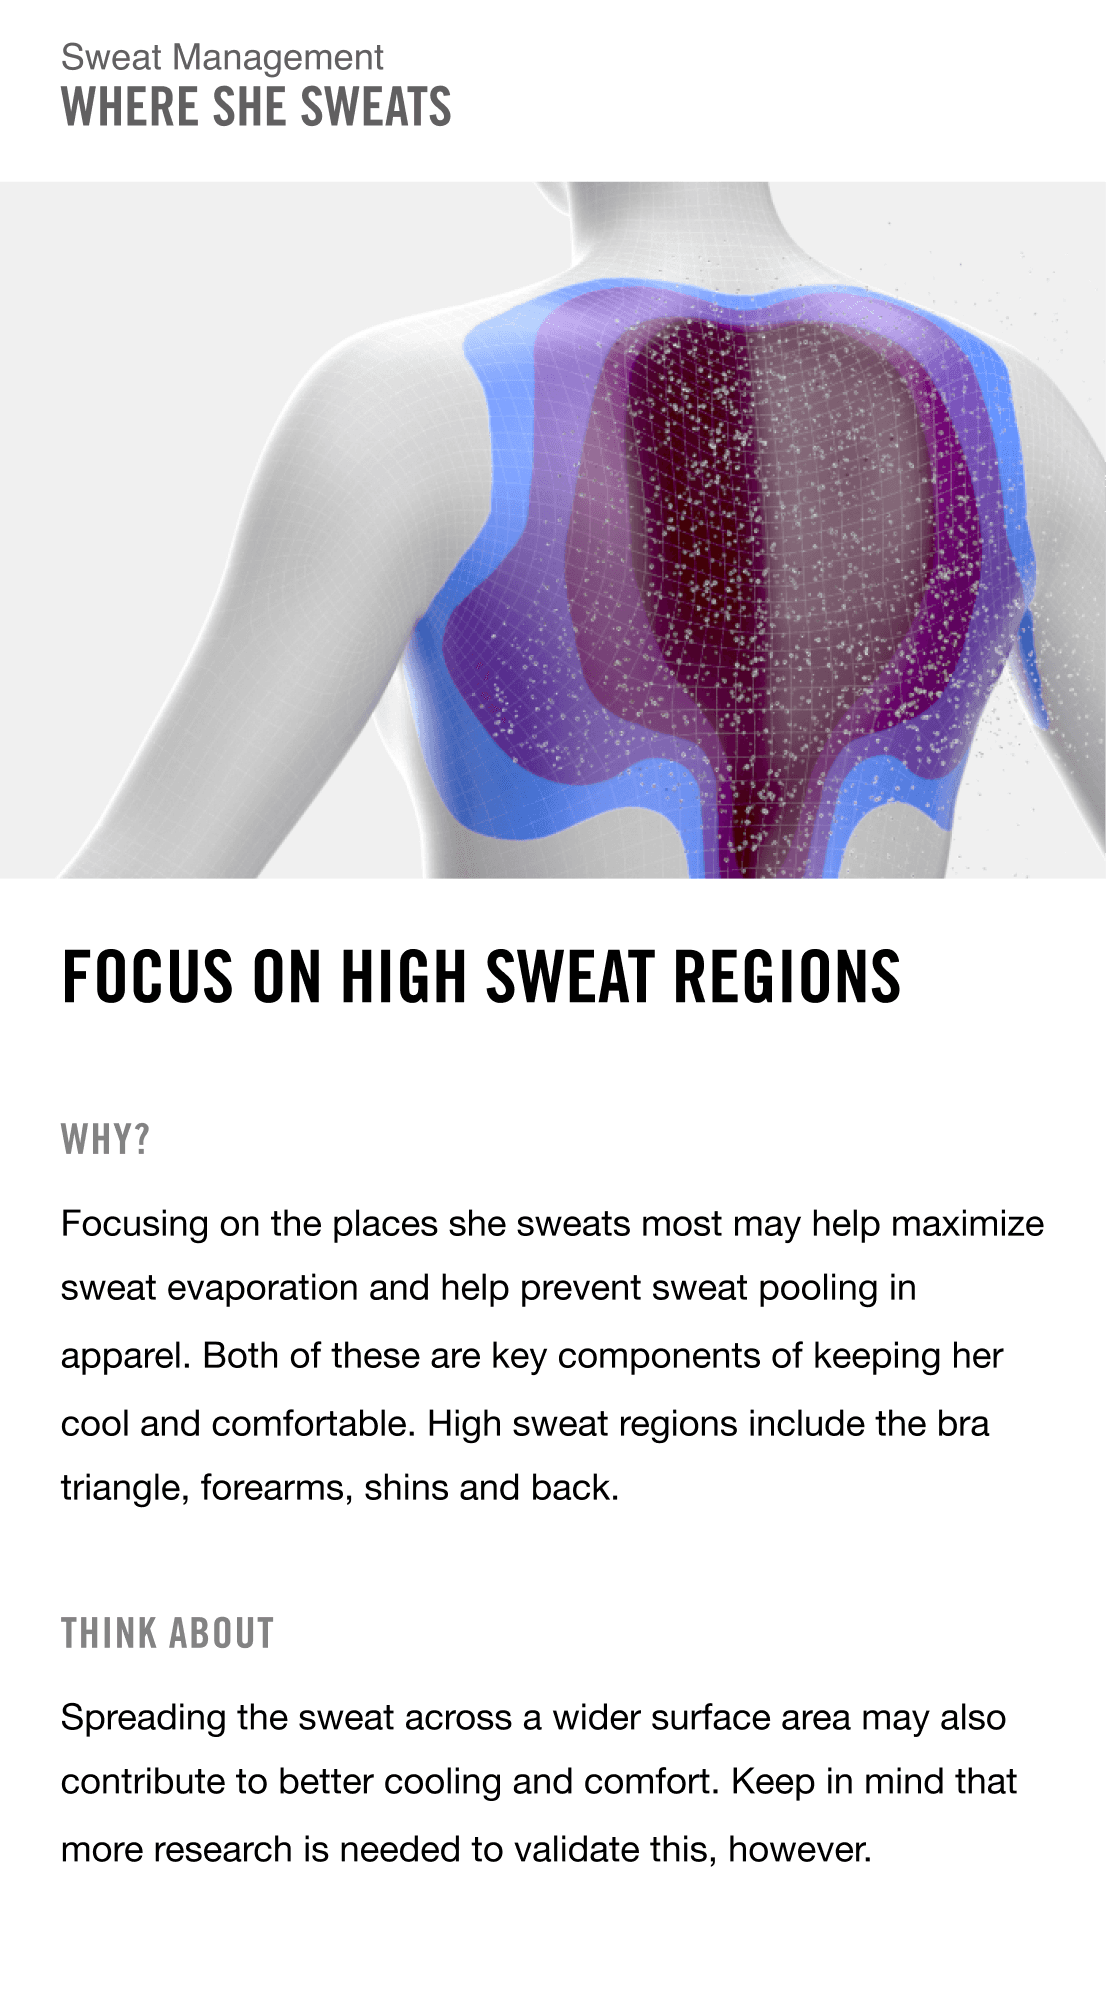
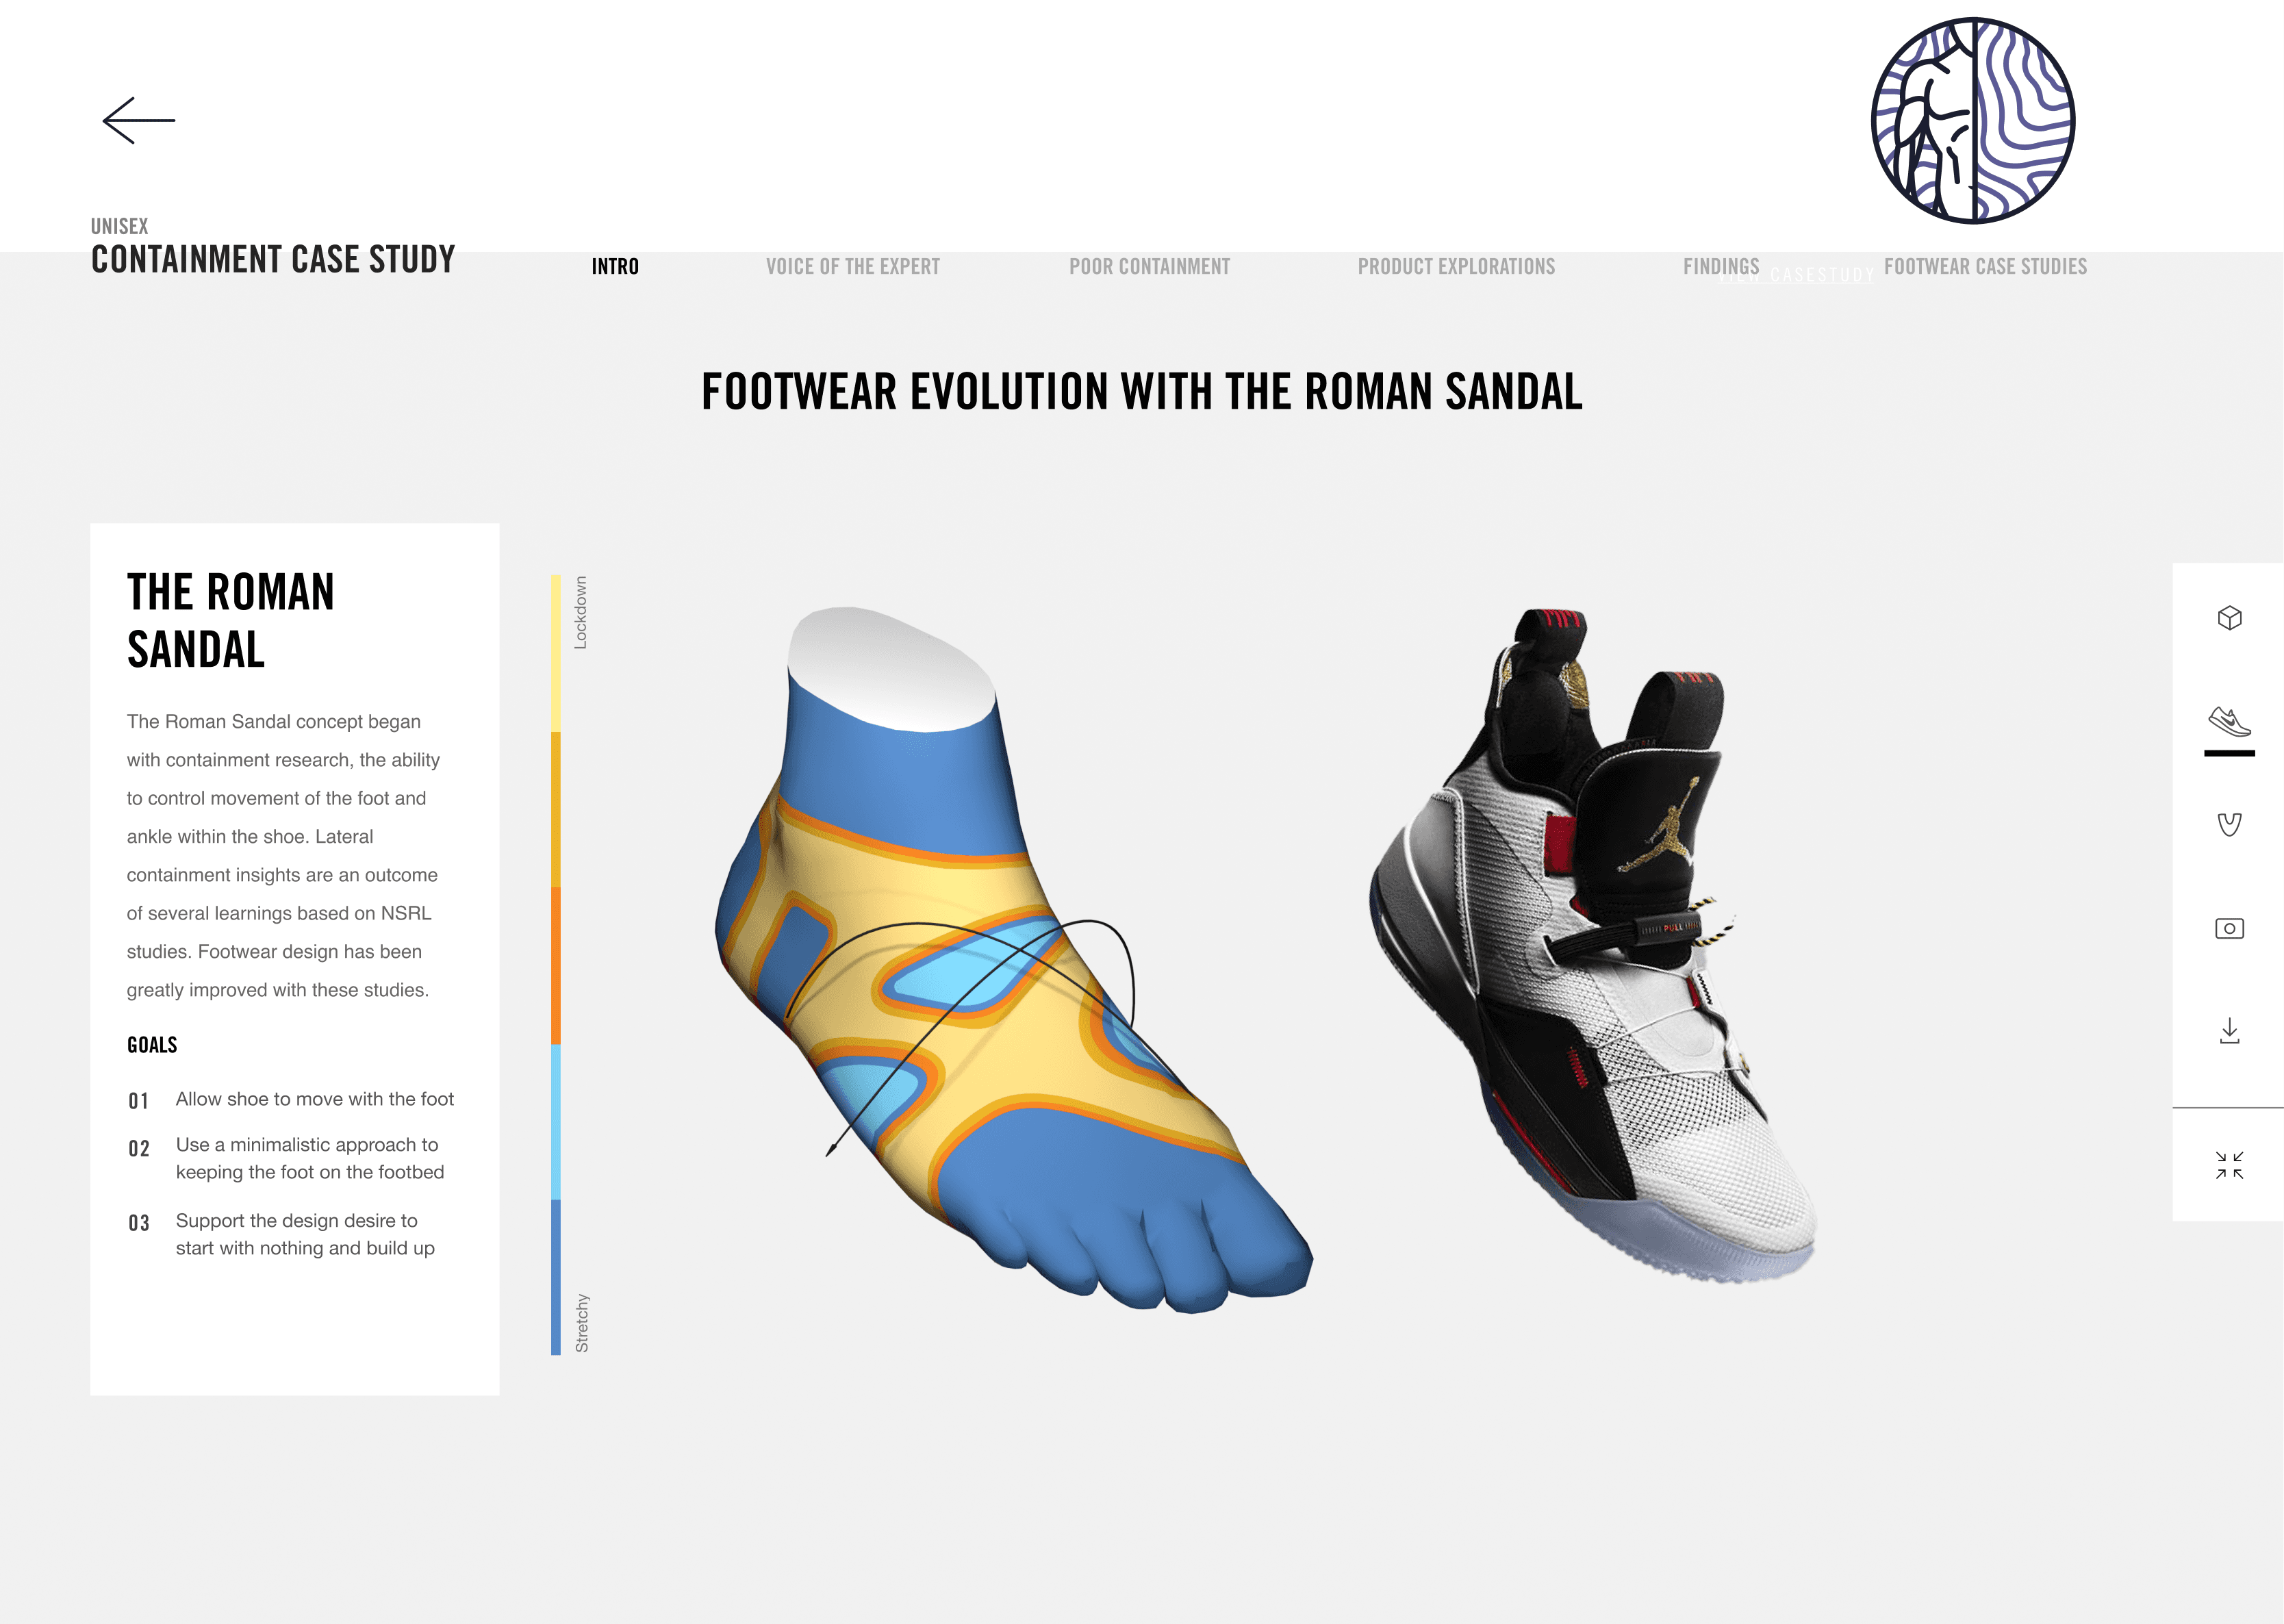
3D Model Integration: Body metrics were visualized through interactive 3D models, allowing designers to see real-time data overlays, such as heat zones, contact points, or stress areas.
Insights & Summaries: Each data set included a short, digestible summary and forward-looking insights to help designers quickly understand relevance and potential applications.
Comparison Mode: I designed and A/B tested a feature that allowed users to compare two sets of metrics side-by-side—whether viewing differences between male and female data or analyzing the same foot under different athletic movements.
Modular Interface: The platform featured a modular layout that allowed designers to customize their view and prioritize the metrics most relevant to their work.
Results
The ATLAS platform became a trusted internal tool for Nike’s design teams—providing easy, centralized access to performance data previously siloed across various departments. Designers reported increased confidence in using data to inform material choices and design decisions. The addition of Comparison Mode proved especially valuable, offering a dynamic way to understand differences across athletes and movements in a format that was both intuitive and insightful. By transforming raw data into a visual, story-driven experience, ATLAS helped close the gap between research and design—empowering Nike's teams to create more informed, athlete-first products.